Sample Reports
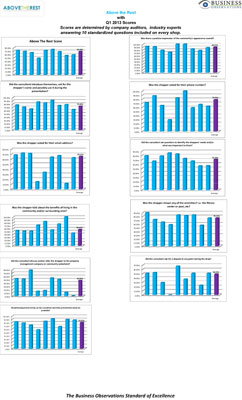
Each quarter our top clients receive the 10 Above The Rest questions as so, one of the blue bars would be marked to indicate scoring placement within the graphs.
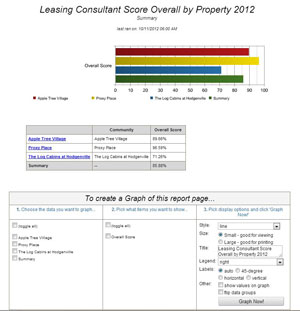
In this sample we picture the control box that allows choosing what specifics can further be graphed, and how that information will appear. Of course, the more shops, the more data there will be to choose from.
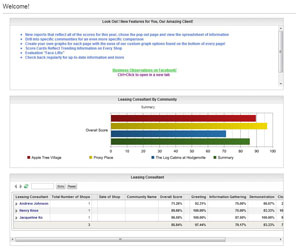
Periodically we change the front page of each client's homepage to reflect the latest data trends. Here is an example of one of our popular dashboards.
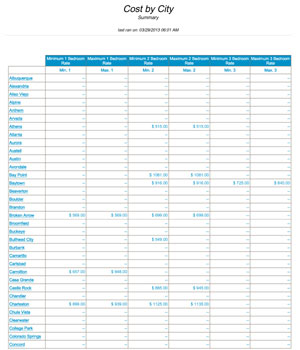
Here is a broad example of rental rates from March of 2013 that showcases just some of the cities we perform shops in. When Market Data reports are ordered, we drill into the data and narrow fields to show specific areas side by side as requested and available.
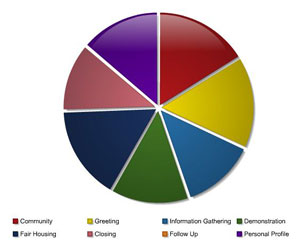
Just a sample of the types of information we can build reports on, here we have common section compared, such as Greeting and Closing. The pie chart style is just one of many we are capable of producing.
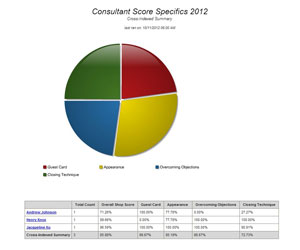
A different example of a pie chart, this one includes a the body of data below. Each report we produce will offer a graph and a spreadsheet of data which will either be in Excel format for continued sorting and/or graphing, or as pictured which is built within our easy to use database for further investigation. Clicking onto a highlighted drills in the next level of information, and additional graphs specific to that label will be automatically generated.
